Reading the Wave: A Tour of Detection Chokepoints Trends
A detection can remain technically correct and still cover less of what threat actors are doing. The invariant hasn’t moved, but the delivery methods, exploitation activity, or infrastructure around it have. Tracking those shifts over time gives us a chance to check our telemetry and tune our hunts before the same behavior reaches our own environment.
The first post in this series made the case for detecting the part of an attack that can’t change. The second walked through one chokepoint entry. The third zoomed out to the attack-chain level and looked at where unrelated operators land on the same techniques. This one is about the part that does change.
The Trends page tracks the movement around a chokepoint: which payload cradles are gaining use, which exploit campaigns are moving from recon to weaponization, and which infrastructure traits survive after a fake download domain gets burned. The chokepoint tells you where to anchor a detection. Trend data tells you what needs tuning around that anchor right now.
TL;DR for busy defenders
- Treat trend data as a tuning input, not an internet-wide prevalence score. Keep the detection pinned to the invariant and use the movement around it to decide which variations need attention.
- For ClickFix, anchor on the unusual parent → interpreter relationship. Keep network-fetch and inline decode-and-execute coverage in parallel, and don’t retire an old cradle rule just because its line briefly drops to zero.
- For exposed edge devices, watch the change from reconnaissance to weaponized exploitation. Check your inventory, patch state, and appliance logging before chasing source IPs.
- A fake software domain is the start of a masquerading hunt, not the finish. Pivot through reused favicons, signers, and backend paths, then move the final detection to execution behavior that survives the next brand or domain change.
A note on the data: this is a best-effort analysis, and it may be incomplete. I’m one person aggregating sources that cover different windows and have different blind spots. Some records and classifications will be incomplete or wrong, and the findings may change as the datasets improve.
The point is what defenders can do with the data available to them. Free sources, paid sources when they’re affordable, and datasets we collect ourselves can expose a technique shift or an infrastructure pattern before the same activity reaches our own environment. It won’t predict every campaign, but a repeated pattern can give us time to verify visibility and decide whether to tune a hunt or close an exposure before it reaches us.
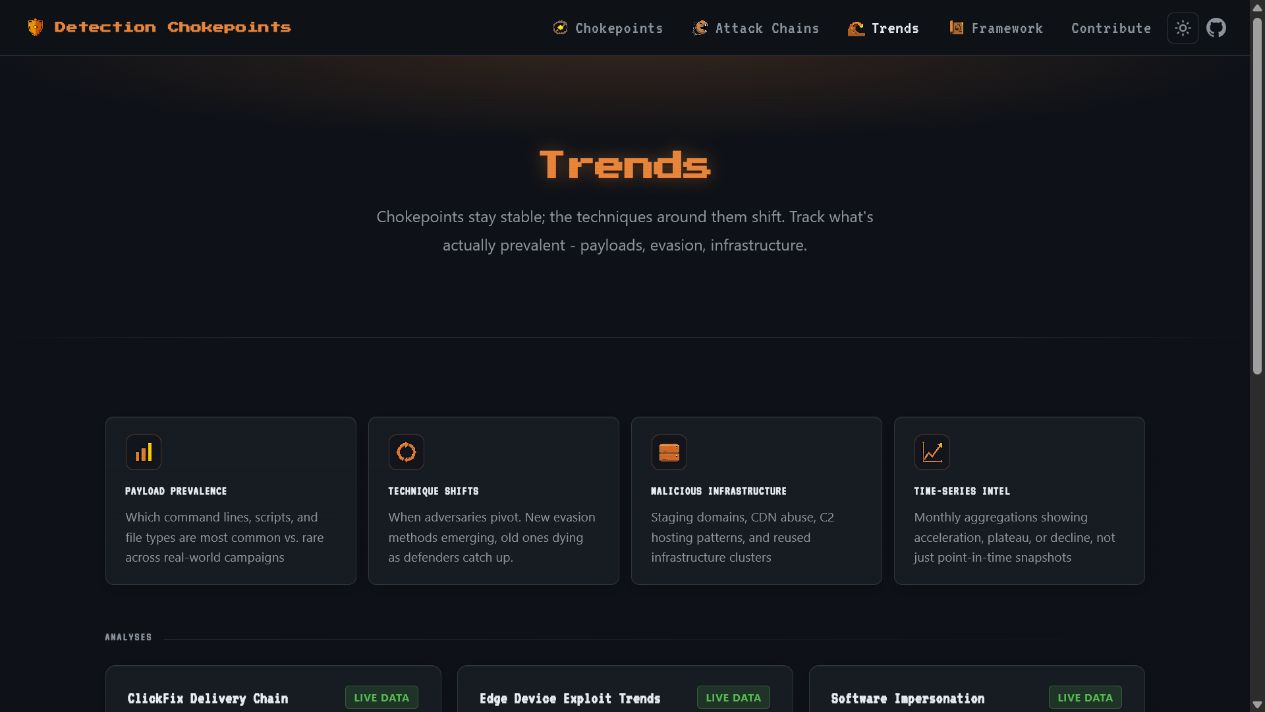
A trend needs to change a defensive decision
Security reports are full of rising percentages. A technique is up, a malware family is down, and some sector is being targeted more than another. Those numbers can be useful, but only if they lead to a decision. Otherwise they are threat-intelligence trivia.
The Trends section is built around a stricter test: after reading the data, what would I deploy, tune, validate, or prioritize differently?
That also means the pages are not trying to measure the entire internet. Each dataset has a collection boundary. ClickGrab sees what its crawlers find. Defused sees what reaches its decoys. My software-impersonation data sees what a set of passive hunts and public reports can validate. Those are three different windows, not three interchangeable prevalence studies. The collection method stays attached to the result so a defender can judge what the number actually supports.
ClickFix: watch the delivery method rotate
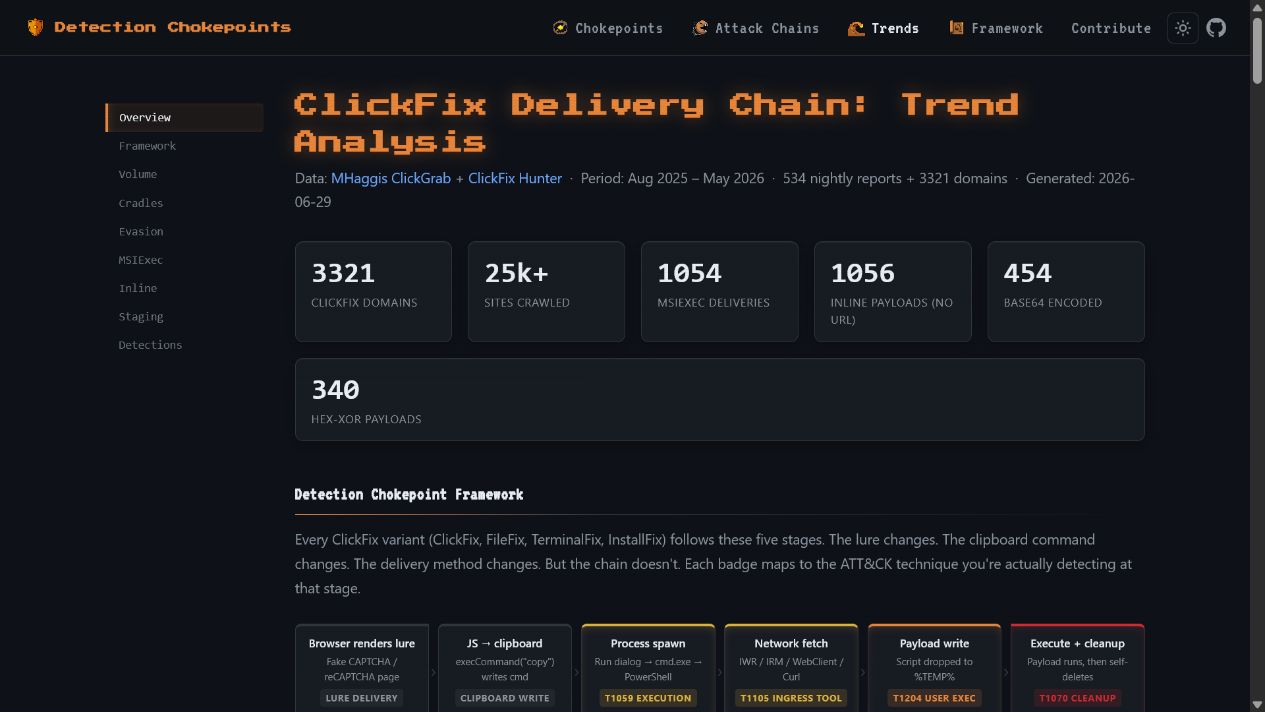
The ClickFix trend analysis combines two datasets that cover different parts of the problem. MHaggis ClickGrab provides nightly crawl volume across more than 25,000 sites. ClickFix Hunter provides the per-domain clipboard commands needed to classify what the lure tells the victim to run.
One gives scale. The other gives behavior. Putting them together turns a pile of malicious domains into a time series of execution choices.
The cradle chart is the easiest example of why this matters. IWR and IEX dropped as WebClient and
curl rose in December 2025, then IWR returned in March. If I had treated the first drop as the end
of IWR-based delivery and removed the rule, I would have created the gap myself. Tradecraft does not
move in one direction. Operators reuse whatever is cheap and working again.
The same data catches larger changes. MSIExec delivery jumped to 87 percent of observed domains in
November, which broke PowerShell-only coverage while leaving the clipboard-to-execution chokepoint
intact. By May 2026, 92 percent of observed domains carried no URL in the clipboard command. Inline
encoded payloads removed the network fetch that many ClickFix detections expected. A WebDAV variant
went farther and used conhost --headless with a UNC path, avoiding both PowerShell and an HTTP URL
in the pasted command.
None of those changes make ClickFix undetectable. They tell us which layer became brittle.
How to use it: keep the unusual parent-to-interpreter rule as the anchor, then run parallel
coverage for the current delivery branches. That means a network-fetch rule for traditional
cradles, decode-and-execute coverage for Base64 and hex-XOR payloads, and process creation coverage
for MSIExec, mshta, and headless conhost from Run-dialog or terminal context. Use the monthly
chart to change the priority and expected volume of those hunts, not to delete coverage when a line
temporarily reaches zero.
The data also helps with validation. If a campaign rotates from IWR to curl, replay both branches
in the lab. A chokepoint claim is stronger when a new variation arrives and the behavioral rule
still fires. If it does not, the trend page has found a real coverage gap instead of another string
to add to a blocklist.
Defused: separate scanning from committed exploitation
The edge-device exploit analysis starts with Defused Cyber honeypot telemetry. The current page covers 25,420 high and critical exploit attempts across more than 25 decoy types, collected in two windows from March 14 through May 19, 2026. More than 50 CVEs appear in the aggregate.
Raw volume is the obvious chart to build from that data, but it is not the most useful one. A spike can be one scanner retrying, a public proof of concept spreading, or several operators moving into weaponized exploitation. Those situations should not produce the same response.
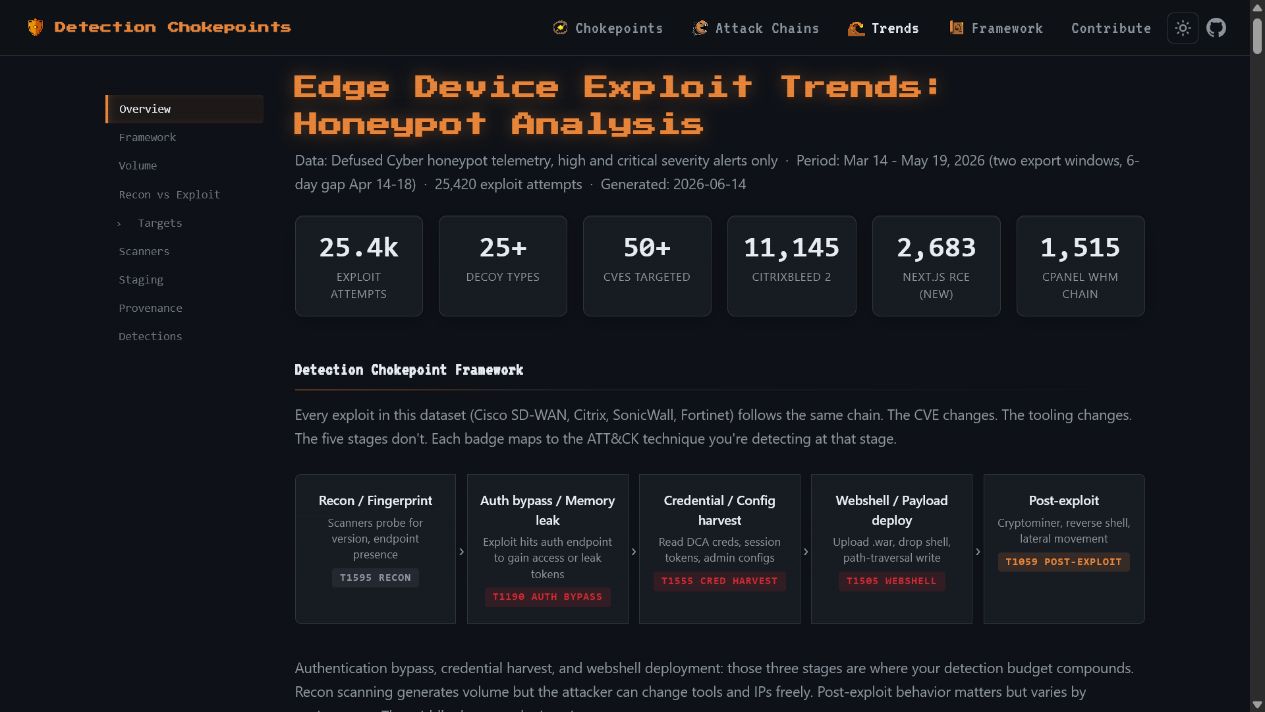
The page splits targeted reconnaissance from alerts Defused classified as weaponized exploitation. That creates an early-warning question: for which CVEs did probing appear before the first exploit, and how much time separated them? It also keeps a high-volume scan from looking more operationally important than a lower-volume campaign that has already reached webshell deployment.
The Cisco SD-WAN activity is a good example. The honeypots recorded operators moving through reconnaissance, authentication bypass, webshell upload, and cryptominer deployment. At that point the useful output is no longer “these IPs scanned a decoy.” It is the set of requests and state changes each operator had to produce to cross those stages.
How to use it: first, intersect the targeted products with your external inventory. If a decoy type is heating up and you own the same product, confirm exposure and patch state before writing a rule. Then validate that the product’s authentication, HTTP, file-write, and outbound network logs reach the SIEM. Build detection around the exploit’s required request or state change, and add an egress hunt for an appliance reaching a new payload host. Source IPs are enrichment. They are not the durable part of the detection.
The recon-versus-exploit split is also useful for prioritization. A rising recon line can move a CVE into the next hunt cycle before weaponization reaches your environment. A confirmed exploit chain should move it out of the backlog entirely. This is one of the few places where a public honeypot can directly inform patching, telemetry, and detection work without pretending its hit count is a global victim count.
Masquerading infrastructure: turn one fake site into a hunt
The software-impersonation page is the dataset I am still building. It tracks infrastructure that impersonates legitimate software brands to deliver a fake installer or a paste-to-run command. The current view combines five validated hunts across five brands with an aggregate IOC pipeline. Two hunts have confirmed payload delivery.
This dataset starts closer to the analyst workflow than the other two. Find one suspicious download page, validate the delivery chain with passive public telemetry, then ask which artifacts can find its siblings. A stolen favicon may lead to other fake domains. A code-signing identity may connect rotated binaries. A reused PHP tracking path can expose the same affiliate kit on another brand.
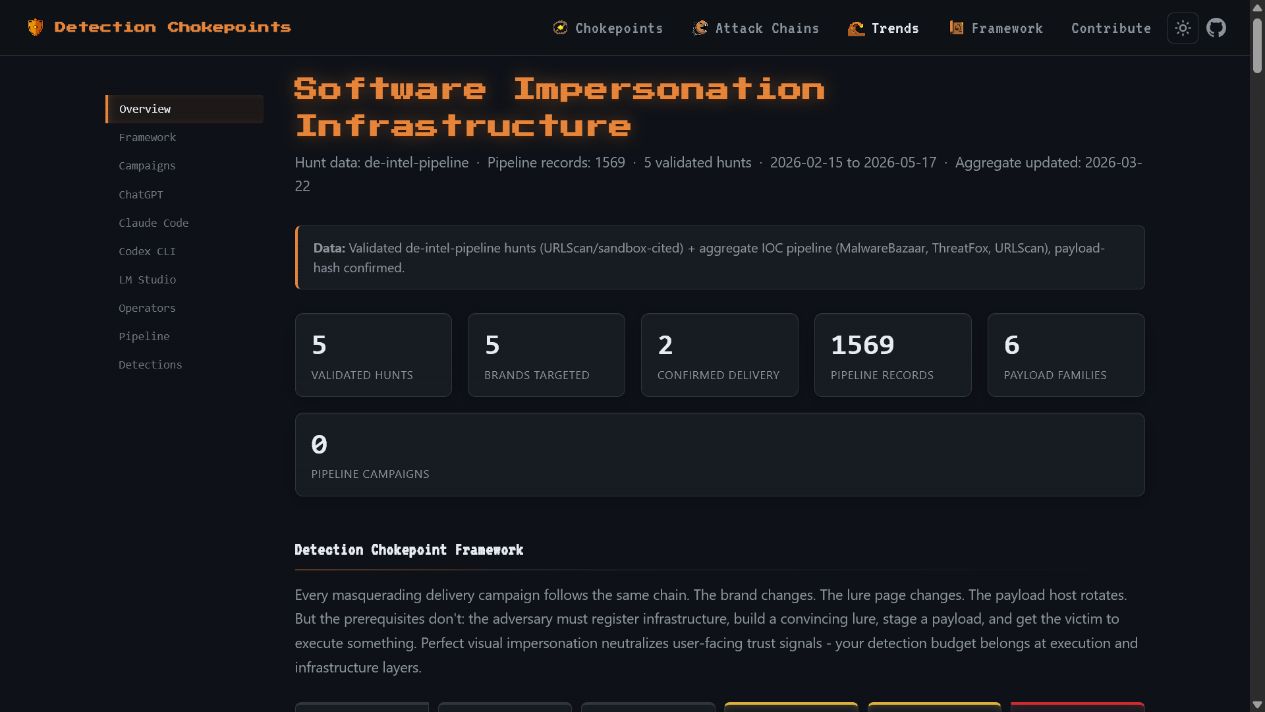
The current hunts show two delivery models aimed at the same general audience. One campaign used a fake ChatGPT installer, gated the download behind JavaScript, staged it on a CDN, and signed the binary with a shell-company certificate. Another cloned Claude Code install pages and gave Windows and macOS users different paste-to-run commands. One puts a signed file in Downloads. The other tries to skip the file and borrow the trust users already place in terminal installation commands.
Those require different endpoint detections, but the infrastructure research can still produce
durable pivots. The fake ChatGPT page reused the real OpenAI favicon, which made favicon-hash hunting
useful. Its JavaScript called a repeatable tracking backend and returned a per-visitor download URL.
The installer signer outlived any one landing-page domain. On the ClickFix side, mshta retrieving a
remote HTA and curl piped into a shell survive a change from Claude to whichever developer tool the
kit copies next.
The failed pivots belong in the dataset too. A Notion favicon search produced thousands of legitimate third-party sites because Notion is widely embedded and used as a publishing backend. That is not a bad hunt result. It tells me favicon reuse is not selective enough for that brand, so the hunt needs title, domain-pattern, file-download, or execution context instead.
How to use it: start with a confirmed lure and keep discovery separate from validation. Use a
favicon, certificate, redirect path, analytics ID, or backend endpoint to find candidates. Confirm
which candidates actually deliver a file or command. Then translate the delivery behavior into an
endpoint or proxy hunt: a newly downloaded signed installer executing from a user’s Downloads
directory, correlated with recent browser download activity; mshta fetching from a non-enterprise
domain; or curl piped to a shell from a terminal. Block the confirmed domains, but do not mistake
that cleanup step for the detection.
What your own dataset needs
The three pages use different sources, but they pass through the same basic process. Start by defining what one row means. Is it a crawled site, a clipboard command, a honeypot alert, a validated campaign, or an IOC copied from another feed? Keep the collection dates, gaps, filters, and source attached. Without that context, a chart can look precise while measuring something nobody can explain.
The observations also need an attack-chain position. The point is not to force every row into ATT&CK. It is to separate the rotating choices from the required steps. For ClickFix, the cradle family rotates while user-driven execution stays fixed. For an edge exploit, the CVE and scanner rotate while the target still has to accept a request, change state, and often retrieve a payload. For masquerading infrastructure, the brand and domain rotate while the operator still has to stage something and persuade the victim to execute it.
From there, test whether a movement is a trend or one campaign passing through the collection window. The May Base64 spike in ClickFix looked enormous, but most of it came from one token in one campaign and collapsed the next month. Hex-XOR persisted across several months. Those should not receive the same weight in a roadmap.
The last step is attaching a defensive action. Every chart should end in a rule to tune, a log source to validate, an exposure to patch, or a hunt to run. If the conclusion is only “activity increased,” the analysis is not finished.
The three views belong together
Chokepoints, Attack Chains, and Trends are three views of the same detection problem.
A chokepoint asks what an attacker must do. An attack chain asks where different threats converge. A trend asks how the implementation around those fixed points is moving. The first gives the rule its anchor, the second helps decide where to spend engineering time, and the third tells you when the surrounding logic needs another look.
Start with the Trends landing page, pick the dataset closest to the telemetry you own, and trace one finding all the way to a defensive change. For ClickFix, that might be adding inline decode-and-execute coverage. For edge devices, it might be confirming that appliance HTTP logs exist before the next exploit wave. For a fake software site, it might be turning one domain into a signer or favicon hunt, then moving the final detection to the execution layer where brand rotation matters less.